California reverse mortgage data: press & media kit
Original analysis of HUD’s loan-level records for every FHA-insured reverse mortgage endorsed in California over twelve monthly releases, September 2025 through August 2026. Key figures, ready-to-use charts, and how to reach me for comment.
The numbers in one glance
4,104 of 24,529 FHA-insured HECMs nationwide
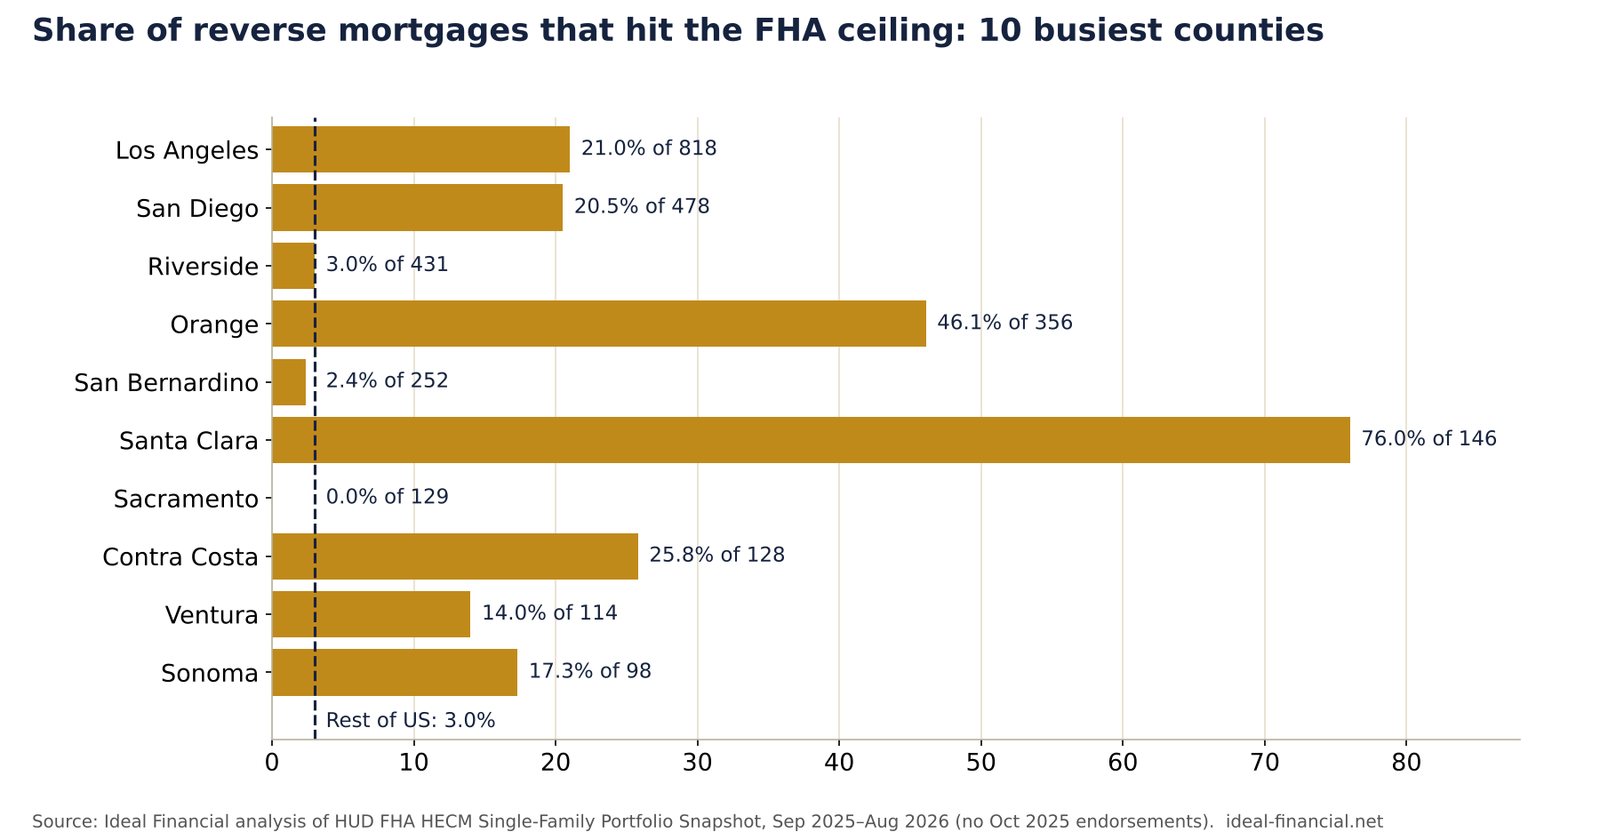
vs 3.0% in the rest of the country, about 6.8 times the rate
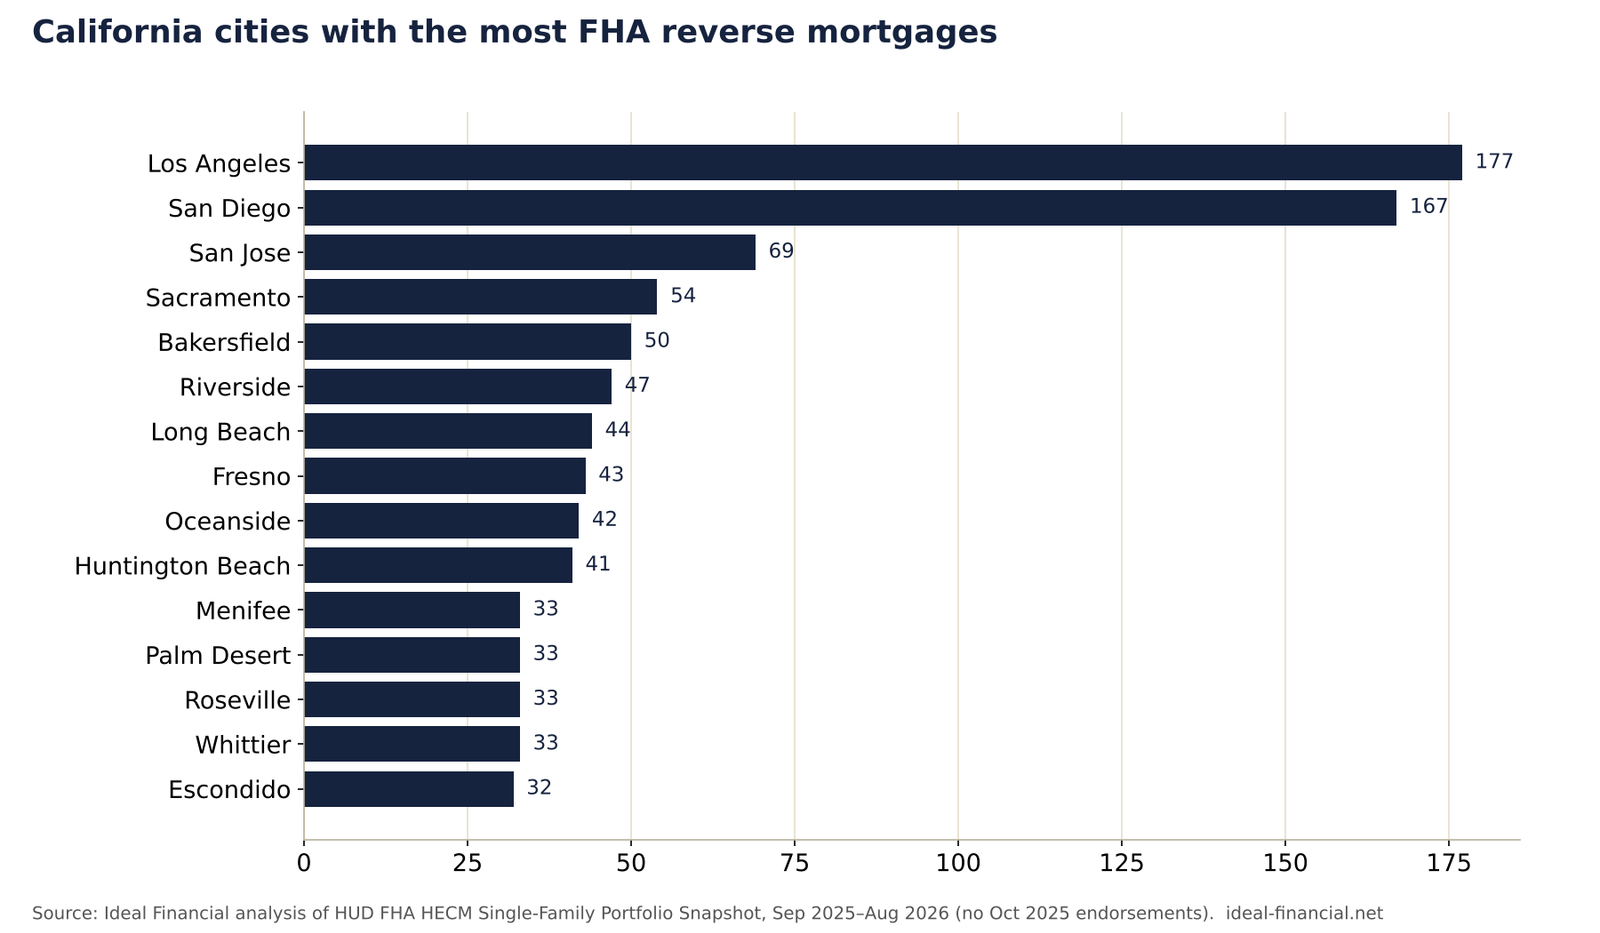
of 1,354 nationwide; Riverside County alone wrote 45
818 loans, 21.0% at the ceiling
County and city tables, and the full method, are in the report: California Reverse Mortgage Activity 2026.
Charts you can use
Each chart carries its source line. Use them in articles, newsletters or presentations; please credit Ideal Financial and link to this page.
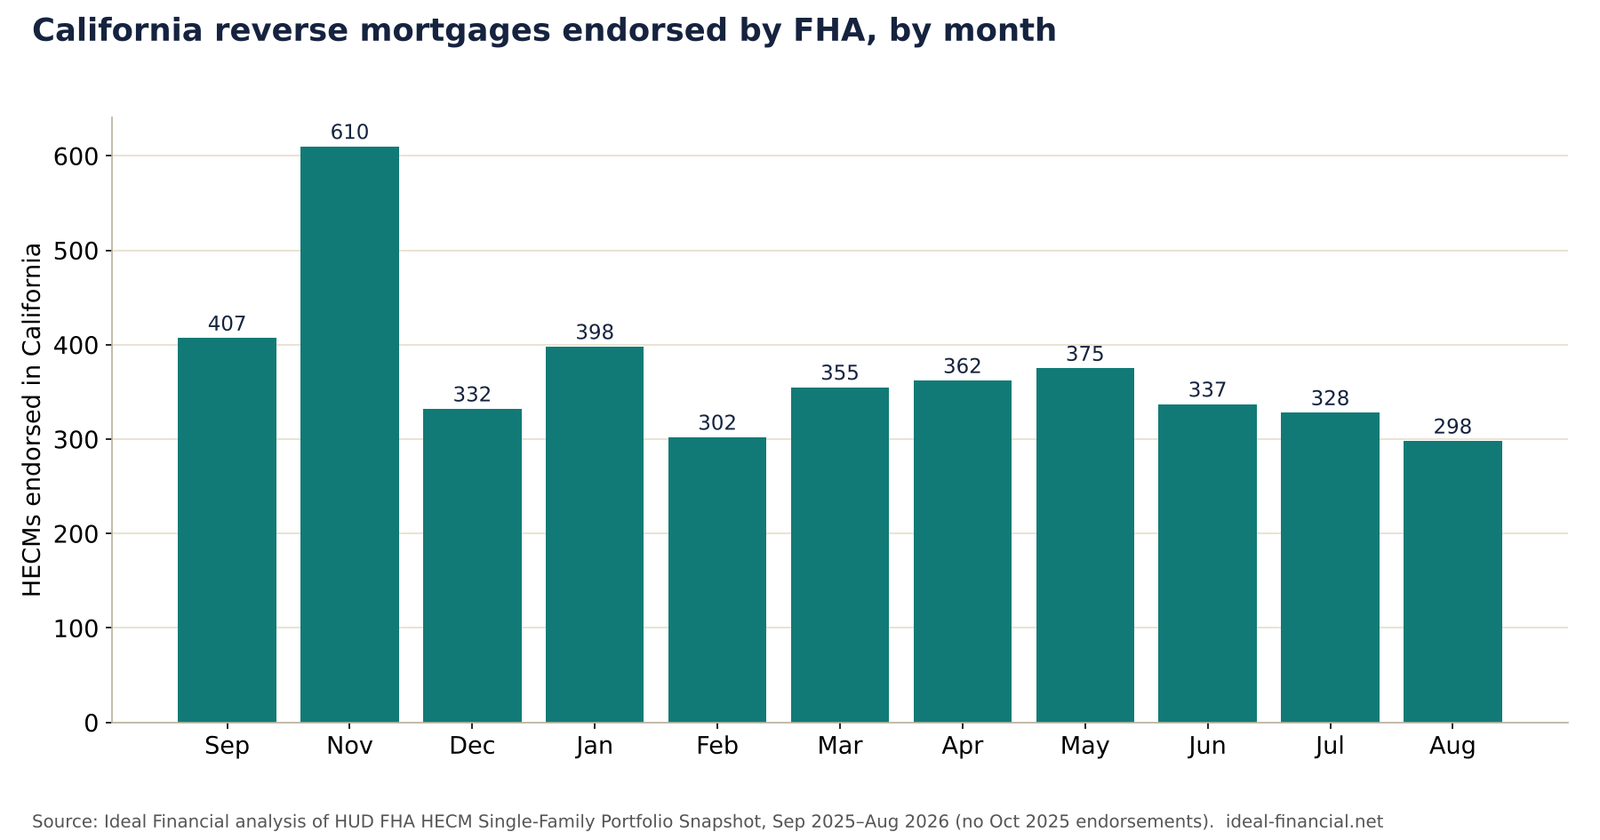
Monthly California endorsements
FHA-ceiling rate, 10 busiest counties
Top 15 cities
How to cite this data
Adler, Kenneth M. “California Reverse Mortgage Activity 2026.” Ideal Financial, Inc., 2026. Analysis of HUD FHA HECM Single-Family Portfolio Snapshot, September 2025 through August 2026. https://ideal-financial.net/california-reverse-mortgage-activity-2026.html
What the data does and doesn’t cover
FHA-insured HECMs only. Proprietary (jumbo) reverse mortgages are not federally insured and do not appear in HUD’s file, so the ceiling rate shows where the FHA program runs out, not total reverse mortgage lending. HUD: “Due to the lapse in appropriations covering the entire month of October 2025, no HECM endorsements were processed.”
About the analyst
Kenneth M. Adler is the broker and owner of Ideal Financial, Inc., a California reverse mortgage brokerage, with 30 years in California lending. CA DRE #01216608, NMLS #240317; company CA DRE #01232726, NMLS #251531. He can speak to what the numbers mean for California homeowners, heirs, and the attorneys and advisors who work with them.
Contact for comment
Call (818) 674-7284 or email ken@ideal-financial.net. I answer personally and can usually respond the same business day.
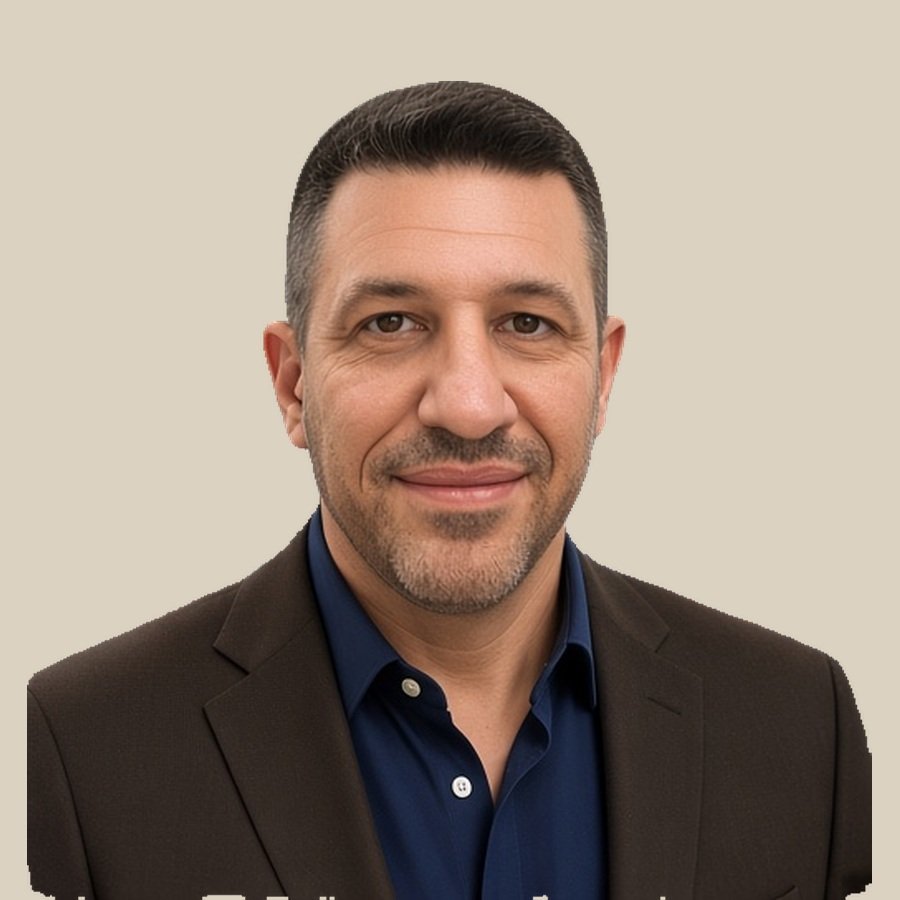
Written by Kenneth M. Adler
Every page on this site is written and maintained by me: the same person who answers the phone, runs your numbers, and handles your file start to finish. No call center, no hand-offs, no lead-selling. More about how I work →