California reverse mortgage activity, 2026
4,104 federally insured reverse mortgages were made on California homes in the last 12 monthly HUD releases, and 20.2% of them ran into the FHA lending limit — about 6.8 times the rate in the rest of the country.
Every county, the busiest cities and the South Bay community by community, counted loan by loan from HUD’s own file. Free to cite with a link.
California reverse mortgage activity at a glance
Every FHA-insured reverse mortgage in the country is recorded by HUD, loan by loan, and published monthly. These are the California figures from the last 12 releases, counted directly from that file rather than estimated.
4,104 California reverse mortgages
FHA-insured HECMs endorsed on California homes, September 2025 through August 2026. That is 16.7% of the 24,529 endorsed nationwide.
20.2% reached the FHA ceiling
Against 3.0% everywhere else in the country: a California borrower is about 6.8 times as likely to have home value the FHA calculation could not count.
166 were used to buy a home
HECM for Purchase loans, 12.3% of the national total. 740 of the 4,104 refinanced an existing reverse mortgage (18%).
Source and method. Counted by me, loan by loan, from the FHA HECM Single-Family Portfolio Snapshot, the file HUD publishes every month listing each FHA-insured reverse mortgage it endorsed. The last 12 monthly releases, September 2025 through August 2026. HUD processed no endorsements in October 2025 — “due to the lapse in appropriations covering the entire month” — so that release is empty and the figures cover 11 months of lending; November 2025 is correspondingly high as the backlog cleared. A loan is counted as reaching the ceiling when its maximum claim amount equals the national limit for its case number ($1,209,750 for 2025, $1,249,125 for 2026). Cities are as HUD records them, which is the mailing city, so a neighborhood such as San Pedro is listed separately from Los Angeles. HECM loans only: proprietary jumbo reverse mortgages are not federally insured and appear in no public dataset.
Every California county with 20 or more HECMs
Sorted by volume. “Hit ceiling” is the share of loans whose maximum claim amount equalled the federal limit — the clearest public signal of where the FHA program runs out of room and a jumbo comparison is worth making.
| County | HECMs | Purchases | HECM refinances | Hit ceiling |
|---|---|---|---|---|
| Los Angeles | 818 | 14 | 175 | 21.0% |
| San Diego | 478 | 12 | 143 | 20.5% |
| Riverside | 431 | 45 | 56 | 3.0% |
| Orange | 356 | 10 | 86 | 46.1% |
| San Bernardino | 252 | 10 | 39 | 2.4% |
| Santa Clara | 146 | 1 | 25 | 76.0% |
| Sacramento | 129 | 9 | 10 | 0.0% |
| Contra Costa | 128 | 2 | 16 | 25.8% |
| Ventura | 114 | 4 | 24 | 14.0% |
| Sonoma | 98 | 9 | 10 | 17.3% |
| Alameda | 87 | 0 | 10 | 40.2% |
| Placer | 85 | 9 | 9 | 4.7% |
| Kern | 77 | 3 | 6 | 0.0% |
| Fresno | 65 | 0 | 8 | 1.5% |
| San Luis Obispo | 64 | 4 | 8 | 14.1% |
| San Mateo | 62 | 0 | 15 | 75.8% |
| San Joaquin | 60 | 3 | 12 | 0.0% |
| Stanislaus | 60 | 4 | 6 | 0.0% |
| Solano | 53 | 6 | 3 | 5.7% |
| Santa Barbara | 44 | 1 | 12 | 36.4% |
| Monterey | 42 | 1 | 12 | 45.2% |
| Santa Cruz | 41 | 0 | 10 | 41.5% |
| Marin | 39 | 0 | 3 | 56.4% |
| El Dorado | 36 | 6 | 2 | 0.0% |
| Tulare | 27 | 1 | 0 | 0.0% |
| Butte | 25 | 0 | 0 | 0.0% |
| Shasta | 25 | 2 | 5 | 0.0% |
| San Francisco | 24 | 0 | 6 | 66.7% |
| Merced | 23 | 0 | 5 | 0.0% |
| Madera | 20 | 1 | 0 | 0.0% |
| Nevada | 20 | 2 | 4 | 20.0% |
A further 22 counties recorded fewer than 20 HECMs each (175 loans between them) and are omitted because a percentage on so few loans means little.
California’s 25 busiest reverse mortgage cities
Each of these cities closed at least 25 loans, enough for a percentage to mean something. Smaller places, like the South Bay communities below, are shown as counts (“13 of 22”) because a percentage on a handful of loans suggests a precision the data does not have. Cities with a page on this site are linked.
| City | County | HECMs | Purchases | Hit ceiling |
|---|---|---|---|---|
| Los Angeles | Los Angeles | 177 | 3 | 26.0% |
| San Diego | San Diego | 167 | 1 | 19.2% |
| San Jose | Santa Clara | 69 | 1 | 69.6% |
| Sacramento | Sacramento | 54 | 4 | 0.0% |
| Bakersfield | Kern | 50 | 3 | 0.0% |
| Riverside | Riverside | 47 | 2 | 2.1% |
| Long Beach | Los Angeles | 44 | 1 | 9.1% |
| Fresno | Fresno | 43 | 0 | 2.3% |
| Oceanside | San Diego | 42 | 1 | 11.9% |
| Huntington Beach | Orange | 41 | 1 | 53.7% |
| Menifee | Riverside | 33 | 3 | 0.0% |
| Palm Desert | Riverside | 33 | 5 | 3.0% |
| Roseville | Placer | 33 | 5 | 0.0% |
| Whittier | Los Angeles | 33 | 0 | 9.1% |
| Escondido | San Diego | 32 | 1 | 12.5% |
| Santa Rosa | Sonoma | 31 | 3 | 9.7% |
| Mission Viejo | Orange | 30 | 2 | 46.7% |
| Modesto | Stanislaus | 29 | 1 | 0.0% |
| Carlsbad | San Diego | 26 | 0 | 53.8% |
| Corona | Riverside | 26 | 1 | 3.8% |
| Hemet | Riverside | 26 | 5 | 0.0% |
| Rancho Cucamonga | San Bernardino | 26 | 0 | 0.0% |
| Garden Grove | Orange | 25 | 0 | 20.0% |
| Murrieta | Riverside | 25 | 4 | 8.0% |
| Santa Clarita | Los Angeles | 25 | 2 | 4.0% |
A page for each of these markets
Each city page applies these figures to that market, with local notes and questions. The number is the city’s own HECM count for the period.
Los Angeles County: Los Angeles (177) · Long Beach (44) · Whittier (33) · Santa Clarita (25) · Torrance (22) · Pasadena (20) · Glendale (7)
San Diego County: San Diego (167) · Oceanside (42) · Escondido (32) · Carlsbad (26)
Riverside County: Riverside (47) · Palm Desert (33) · Menifee (33) · Corona (26) · Hemet (26) · Temecula (25)
Orange County: Huntington Beach (41) · Mission Viejo (30) · Garden Grove (25) · Anaheim (24) · Irvine (14)
San Bernardino County: Rancho Cucamonga (26)
Santa Clara County: San Jose (69)
Sacramento County: Sacramento (54)
Contra Costa County: Walnut Creek (14)
Ventura County: Thousand Oaks (15) · Simi Valley (15)
Sonoma County: Santa Rosa (31)
Placer County: Roseville (33)
Kern County: Bakersfield (50)
Fresno County: Fresno (43)
Stanislaus County: Modesto (29)
San Francisco County: San Francisco (22)
The South Bay, community by community
Ideal Financial’s office is on Crenshaw Boulevard in Torrance, so here is the South Bay in full, including the communities too small to appear in the statewide list.
| Community | HECMs | Hit ceiling |
|---|---|---|
| Torrance | 22 | 13 of 22 |
| Redondo Beach | 6 | 4 of 6 |
| Manhattan Beach | 2 | 2 of 2 |
| Hermosa Beach | 1 | 1 of 1 |
| Palos Verdes Estates | 2 | 2 of 2 |
| Rancho Palos Verdes | 6 | 5 of 6 |
| Rolling Hills Estates | 1 | 1 of 1 |
| Rolling Hills | 1 | 1 of 1 |
| Lomita | 3 | 1 of 3 |
| Carson | 8 | 0 of 8 |
| Gardena | 5 | 0 of 5 |
| Hawthorne | 6 | 2 of 6 |
| Lawndale | 3 | 0 of 3 |
| San Pedro | 4 | 0 of 4 |
| Harbor City | 2 | 0 of 2 |
| Wilmington | 2 | 0 of 2 |
74 reverse mortgages, 32 at the ceiling. Across the 16 South Bay communities with at least one HECM, 74 loans closed and 32 of them reached the federal limit.
The Peninsula is a jumbo market. On the Palos Verdes Peninsula 9 of 10 HECMs hit the ceiling. Homes there routinely exceed the limit by a wide margin, so the FHA calculation leaves much of the value uncounted and the proprietary calculation should be run first.
Away from the coast, the HECM does the job. In Carson, Gardena, Hawthorne and Lawndale, 2 of 22 reached the ceiling. For most of those homes the FHA program counts essentially the full value.
Torrance sits in between: 13 of 22. That is exactly the market where I run both calculations side by side. Reverse mortgages in Torrance →
Four things this data settles
Most reverse mortgage advice is generic. These are specific, and each one changes what you should ask for.
The FHA limit is a California problem
20.2% of California HECMs hit the ceiling against 3.0% elsewhere. In the highest-value counties it is most loans, not some. If your home is worth more than the limit, ask to see a proprietary jumbo calculation beside the HECM. How the jumbo differs →
Inland, the HECM usually wins
Ten counties, including Sacramento, Kern and San Joaquin recorded no loans at the ceiling at all, and Riverside County only 3.0%. Where values sit under the limit, the federally insured program counts essentially the whole home, and a jumbo buys nothing but a different cost structure.
Buying with a reverse mortgage is still rare
Only 166 California HECMs were used to buy a home, and 45 of those were in Riverside County. In Los Angeles County it was 14 out of 818. It is an under-used tool for right-sizing without a new monthly payment. How HECM for Purchase works →
One loan in six is a refinance
740 of the 4,104 California HECMs (18%) refinanced an earlier reverse mortgage, usually to reach a higher limit or a better structure after values rose. A refinance only makes sense when the benefit clearly outweighs the new costs, and I will tell you if yours does not.
California’s share, release by release
The national program is steady at around two thousand endorsements a month. The November 2025 spike is the October shutdown backlog clearing, not a surge in demand.
| Release | California | Nationwide | California share |
|---|---|---|---|
| Sep 2025 | 407 | 2,211 | 18.4% |
| Nov 2025 | 610 | 3,903 | 15.6% |
| Dec 2025 | 332 | 2,184 | 15.2% |
| Jan 2026 | 398 | 2,294 | 17.3% |
| Feb 2026 | 302 | 1,819 | 16.6% |
| Mar 2026 | 355 | 2,116 | 16.8% |
| Apr 2026 | 362 | 2,087 | 17.3% |
| May 2026 | 375 | 1,966 | 19.1% |
| Jun 2026 | 337 | 2,054 | 16.4% |
| Jul 2026 | 328 | 1,978 | 16.6% |
| Aug 2026 | 298 | 1,917 | 15.5% |
California reverse mortgage statistics: common questions
Short answers, each drawn from the tables above.
How many reverse mortgages were made in California in the last year?
How often do California reverse mortgages hit the FHA lending limit?
Which California counties hit the ceiling most often?
How many reverse mortgages were used to buy a home in California?
How many reverse mortgages closed in Torrance and the South Bay?
Can I use these figures?
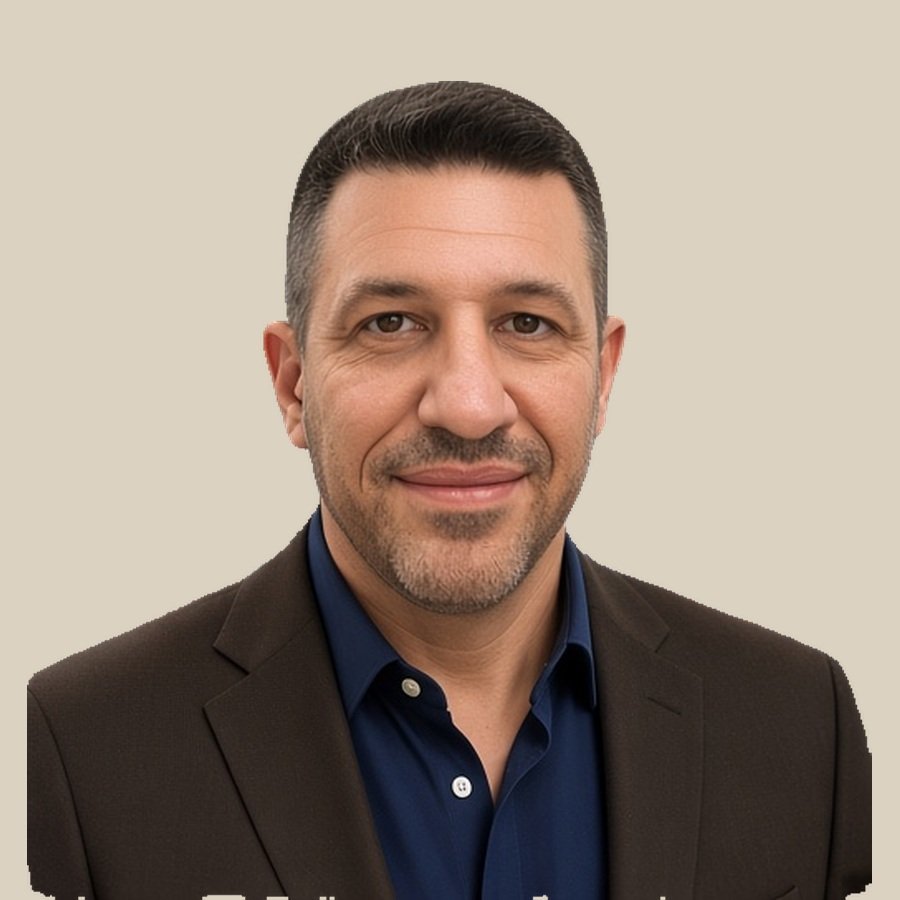
Written by Kenneth M. Adler
Broker & Owner, Ideal Financial, Inc. · 30 years in California lending · NMLS #240317 · CA DRE #01216608
Published September 24, 2026 · Last reviewed October 8, 2026
Every page on this site is written and maintained by me: the same person who answers the phone, runs your numbers, and handles your file start to finish. No call center, no hand-offs, no lead-selling. More about how I work →
The rest of the reverse mortgage library
Each page below covers one decision in full, rather than a paragraph of it. Start wherever your question is.
Fifteen minutes. Real numbers. Then you decide.
Tell me the scenario and I’ll tell you honestly whether this is the right tool. If it isn’t, you’ll leave the call knowing why, and I’ll point you at whatever is.
(818) 674-7284Prefer email?
Send a couple of sentences about your situation and I’ll reply personally, usually the same business day.
Contact Ken Book a call